Weather monitoring
Frasso Sabino
- Dettagli
- Visite: 10686
Frasso Sabino Current Weather Conditions
Osservatorio astronomico V.Cesarini
[Select Refresh to Update]
|
You can find the data of this station on: |
Sky quality meter
- Dettagli
- Visite: 12628
Light pollution: what is it and why is it important to know ? [abstract from Dark Skies Awareness]
Light pollution is excessive and inappropriate artificial light. The four components of light pollution are often combined and may overlap: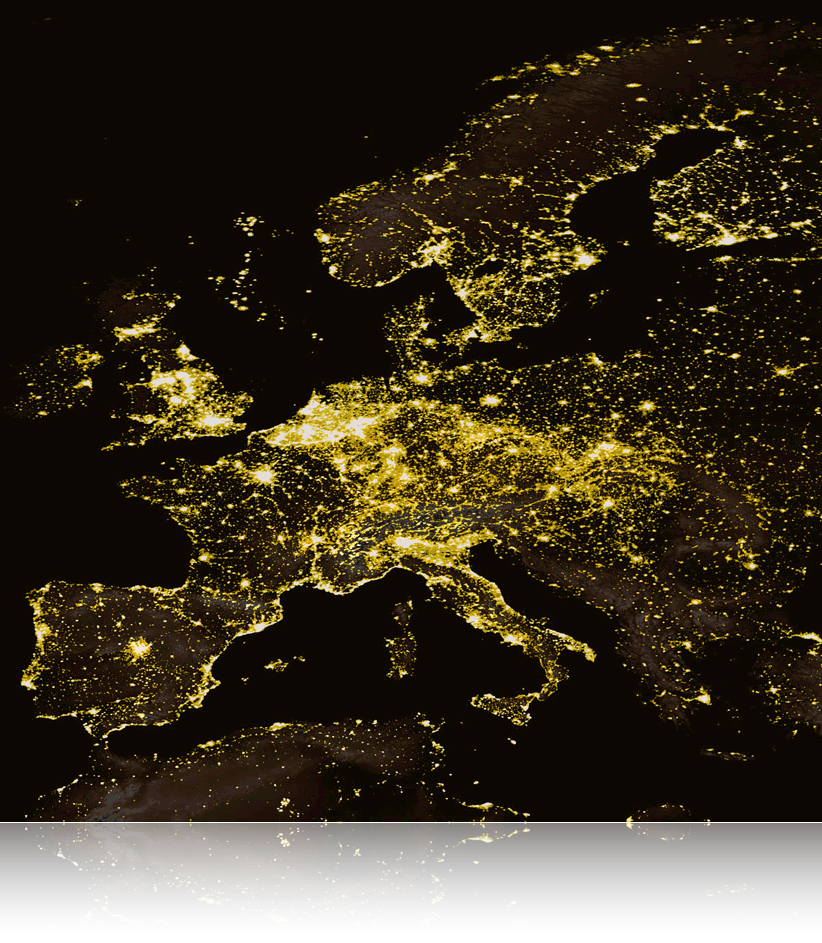
- Urban Sky Glow—the brightening of the night sky over inhabited areas.
- Light Trespass—light falling where it is not intended, wanted, or needed.
- Glare—excessive brightness which causes visual discomfort. High levels of glare can decrease visibility.
- Clutter—bright, confusing, and excessive groupings of light sources, commonly found in over-lit urban areas. The proliferation of clutter contributes to urban sky glow, trespass, and glare.
For most of Earth’s history, our spectacular universe of stars and galaxies has been visible in the darkness of the night sky. From our earliest beginnings, the vast spectacle arrayed across the dark sky has inspired questions about our universe and our relation to it. The history of scientific discovery, art, literature, astronomy, navigation, exploration, philosophy, and even human curiosity itself would be diminished without our view of the stars. But today, the increasing number of people living on earth and the corresponding increase in inappropriate and unshielded outdoor lighting has resulted in light pollution—a brightening night sky that has obliterated the stars for much of the world’s population. Most people must travel far from home, away from the glow of artificial lighting, to experience the awe-inspiring expanse of the Milky Way as our ancestors once knew it.
 The negative effects of the loss of this inspirational natural resource might seem intangible. But a growing body of evidence links the brightening night sky directly to measurable negative impacts on human health and immune function, on adverse behavioral changes in insect and animal populations, and on a decrease of both ambient quality and safety in our nighttime environment. Astronomers were among the first to record the negative impacts of wasted lighting on scientific research, but for all of us, the adverse economic and environmental impacts of wasted energy are apparent in everything from the monthly electric bill to global warming.
In refreshing contrast to some of today’s complex and lingering environmental problems, many existing solutions to light pollution are simple, cost-effective, and instantaneous. Recognizing when outdoor lighting no longer serves its function and becomes a pollutant is the first step toward choosing appropriate solutions.
Increased urban sky glow is responsible for the disappearance of the Milky Way from our night skies. For professional astronomers, the increasing distance to prime observing sites, well away from sources of air pollution and urban sky glow, becomes more problematic as economic and environmental energy costs continue to rise. Amateur astronomers, meanwhile, find prime observing spots eradicated by commercial and residential development and must travel farther from home for a clear view of the skies. Increasingly, the most important equipment needed to enjoy the wonders of the night sky is an automobile with a full tank of gas and a map.
I decided to continuously monitor the sky brightness in Poggio Corese - Scandriglia(RI)
FROM NightSkyPix I suggest to read their article:
If you are into deep sky astrophotography, you know the struggle of having to juggle with your free time, the absence of a large, bright Moon in the sky, and a clear sky is real.
And now, on top of that, you have to consider man-made light pollution as well.
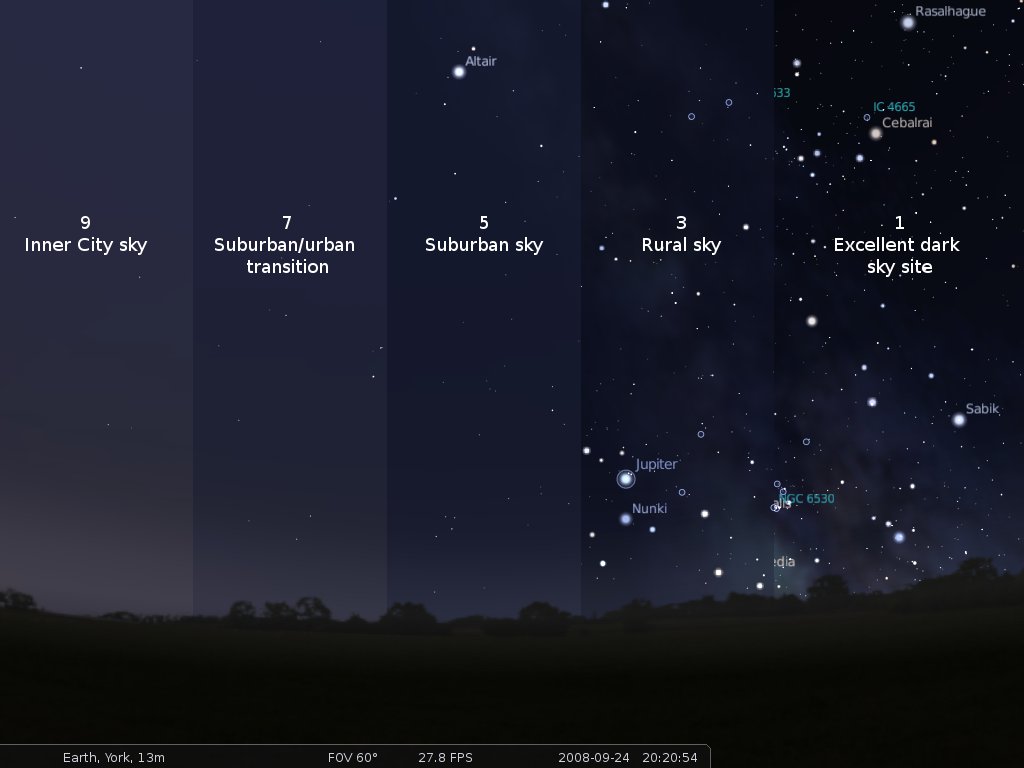
But how bright is your sky, and what can you do about it? The Bortle scale offers a simple answer that is easy to understand.
What Is The Bortle Scale? Light Pollution Classes Explained
Thanks to Andrea Minoia who wrote the article and to Carlo Piscioneri who introduced me to their site.
|
|
 |
| The Sky Quality Meter is an Unihedron product | Meter is operational during Astronomical Twilight hours (EST). |
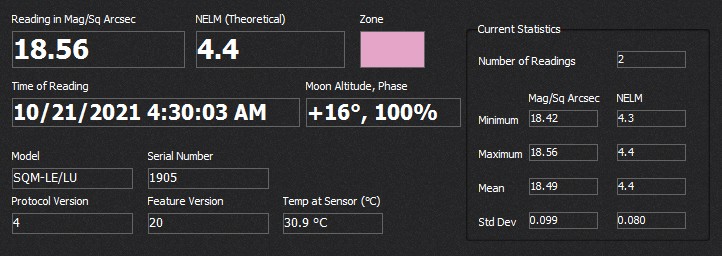
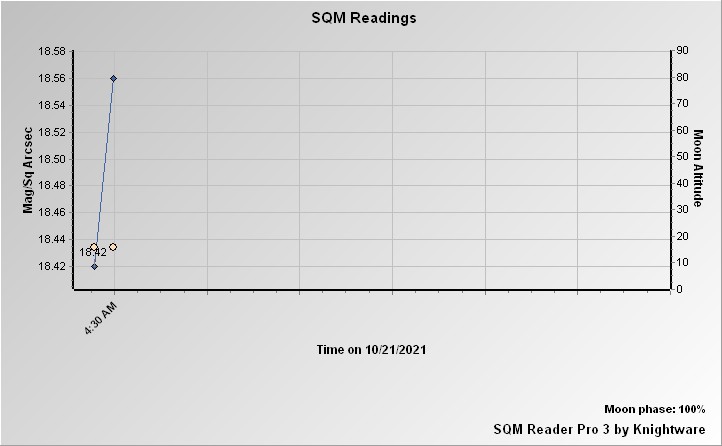
Lo Sky Quality Meter (SQM) è uno strumento che con un sensore CCD rivolto verso l’alto misura la luminosità del cielo in magnitudine x arco secondo-quadrato.
La magnitudine è usata in astronomia per misurare la luminosità delle stelle (e degli altri oggetti celesti). Alcuni punti di riferimento sono:
- magnitudine –26,8 = Sole
- magnitudine –12,6 = Luna piena
- magnitudine -1,5 = stella Sirio
- magnitudine +6,0 = le stelle meno luminose visibili ad occhio nudo
L’arco secondo quadrato è il quadratino di cielo di lato pari ad un arco secondo di grado, cioè la 3.600-ma parte di un grado. (La luna ha un diametro di mezzo grado, quindi 1.800 secondi d’arco).
Quindi, quando SQM rileva – ad esempio – 20 mgn/arcsec2, il cielo è abbastanza scuro, quando rileva 10 mgn/arcsec2, il cielo è molto più chiaro. I rilevamenti vengono fatti ovviamente, di notte, e ci permettono di misurare l’effetto dell’illuminazione artificiale provocata dall’uomo, verso il cielo. La situazione metereologica incide su queste misure: con il cielo nuvoloso la luminosità è maggiore, perchè le nuvole riflettono la luce artificiale. Per questo motivo l’SQM può essere usato in meteorologia per rilevare la nuvolosità del cielo. I dati live possono essere un prezioso ausilio all’astrofilo per determinare la migliore serata per la fotografia astronomica. Più altò è il valore della magnitudine è più il cielo è buio. Un cielo con assenza di inquinamento luminoso da un valore medio di 22 di magnitudine, al contrario, in presenza di un forte inquinamento come si può avere in una città, il valore è intorno a magnitudine 17. Valore che indica una luminoso del cielo 40 volte superiore. ( Fonte ARPAV)
|
The Scandriglia SQM partecipates to the following networks |
||
|
Useful links about light pollution |
||
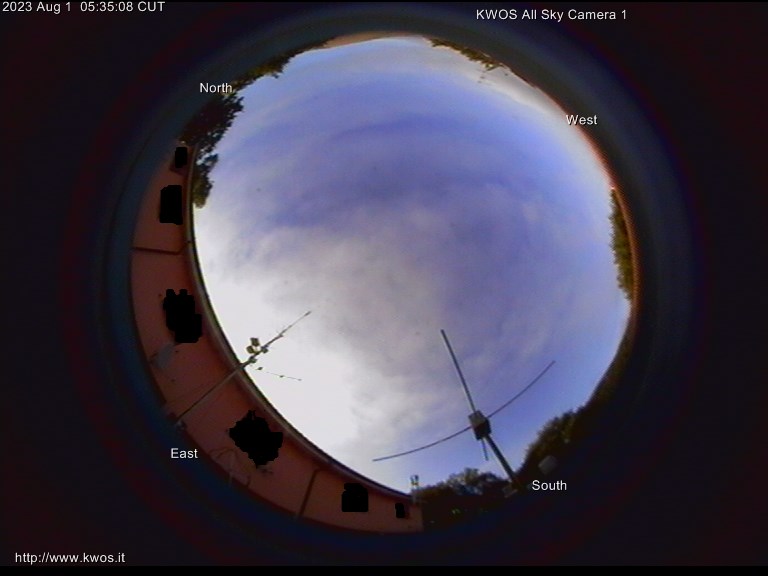
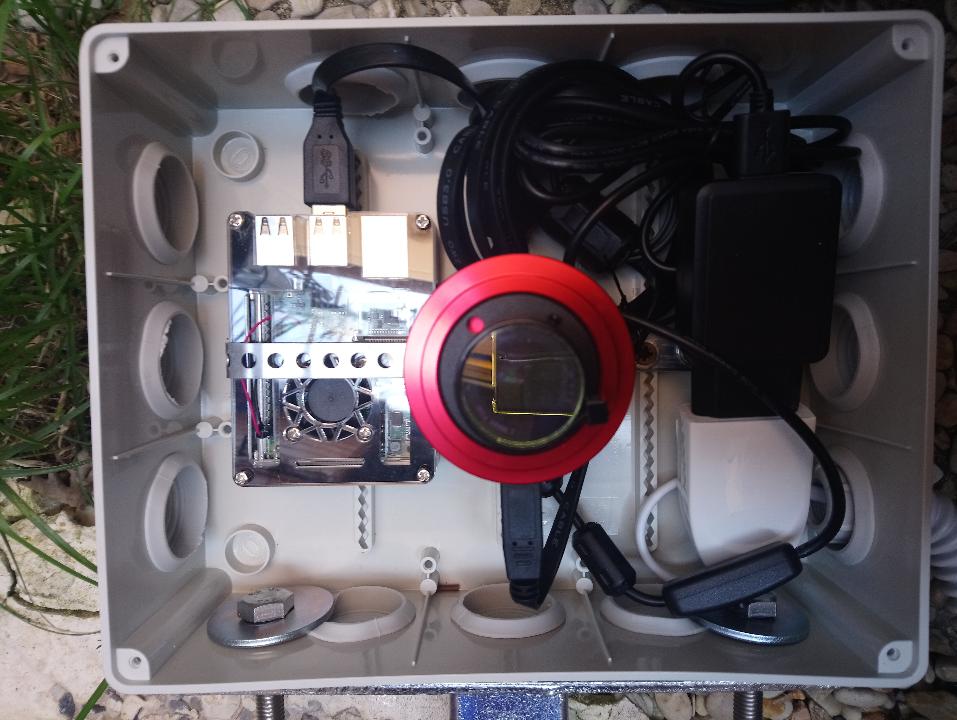
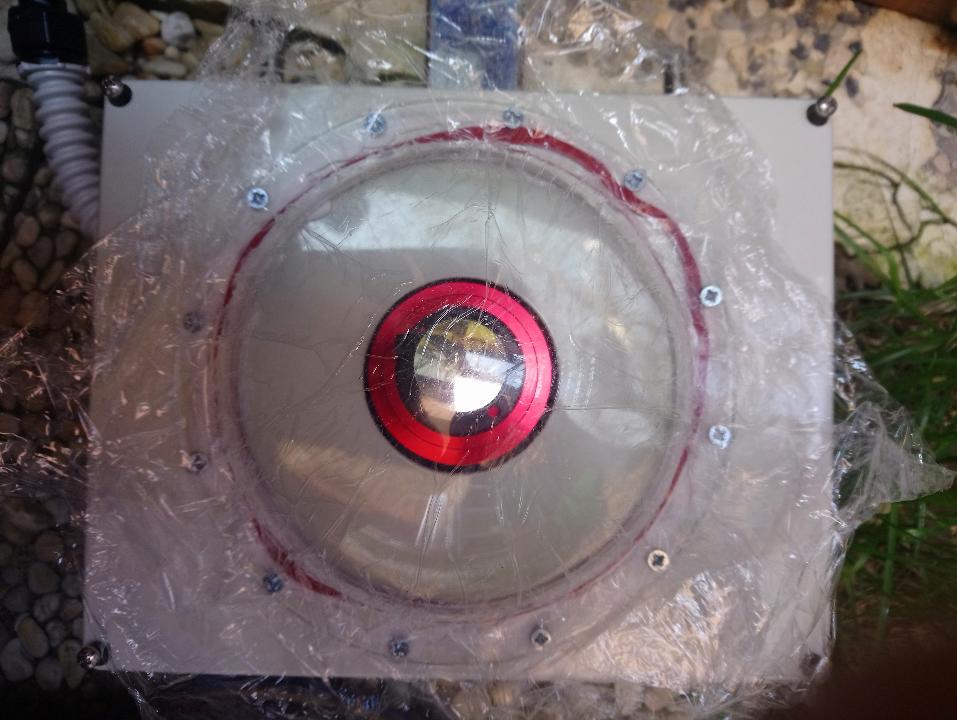
Night AllSky Cam
- Dettagli
- Visite: 8458
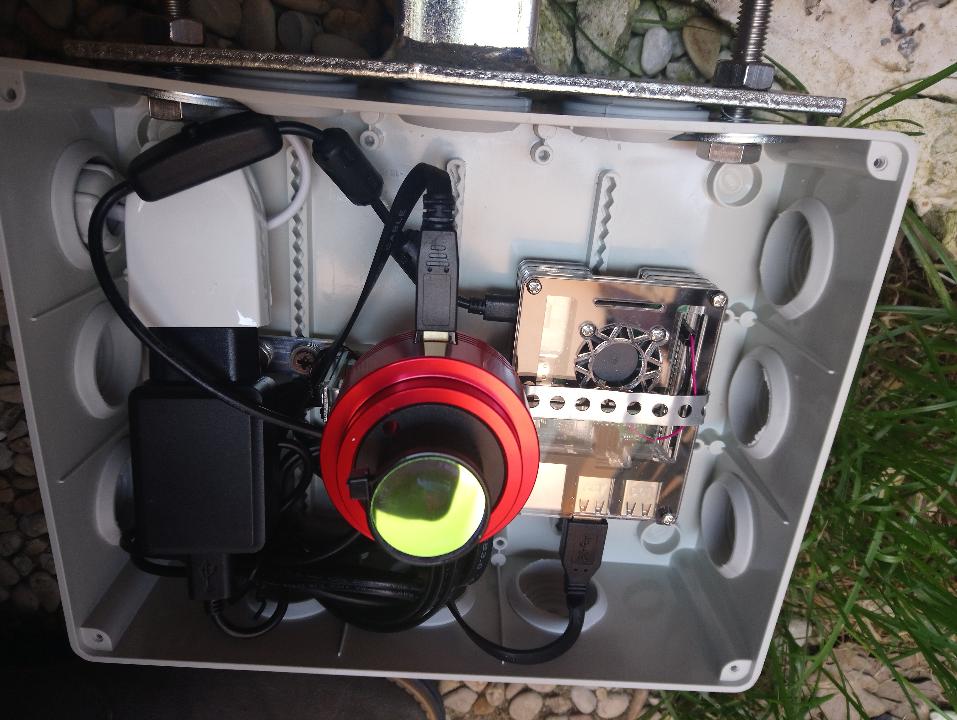
Ero alla ricerca di una macchina fotografica che permettesse di registrare il cielo notturno con una risoluzione migliore della Moonglow.
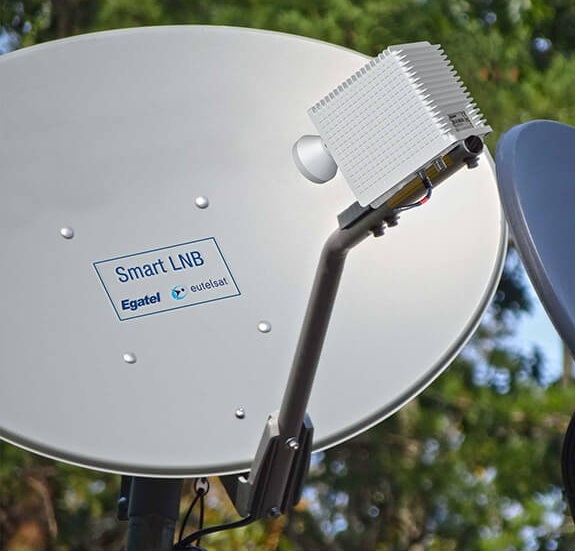
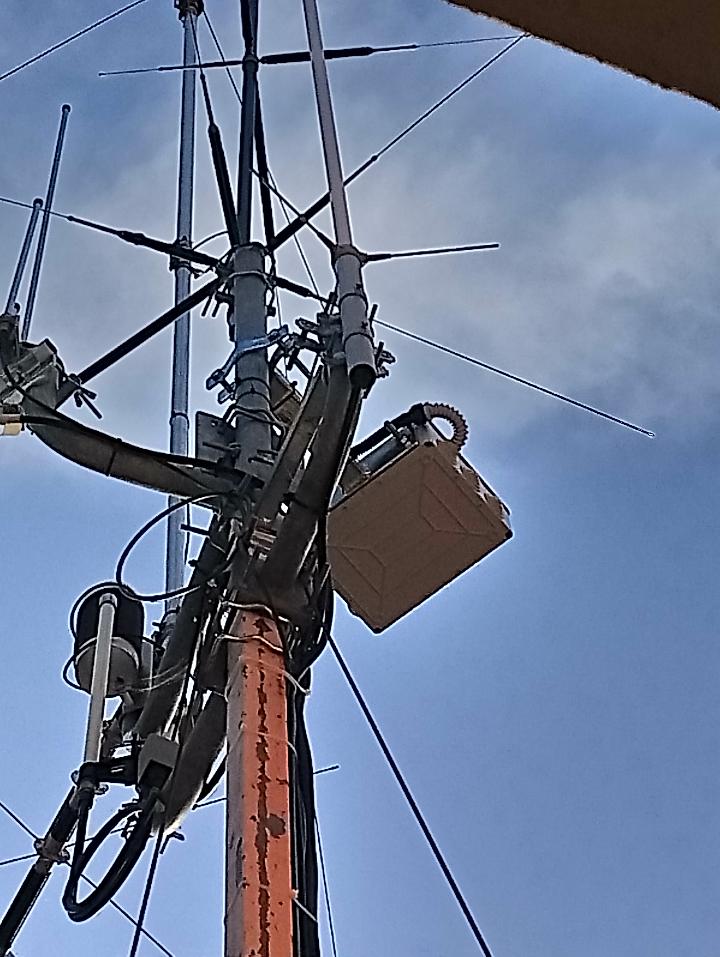
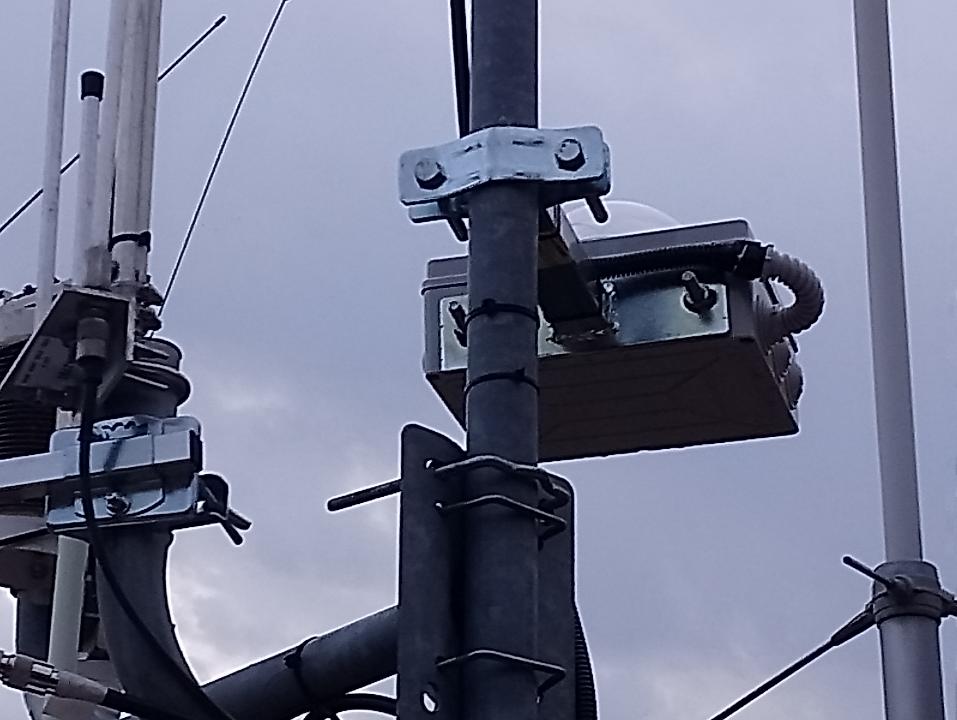
Inoltre, ero alla ricerca di una soluzione che avesse potuto inviare le immagini automaticamente sul sito web e se fosse stato possibile, installarla sul palo principale delle antenne.
Su Internet ho trovato l'eccellente progetto creato da Thomas Jacquin.
La fotocamera usata è: ASI178MC
Il filtro sulla fotocamera è: Omegon deepsky filter
 |
 |
 |
 |
 |
 |
Il risultato:
http://www.kwos.org/weather/allsky/
Ora è anche diurna
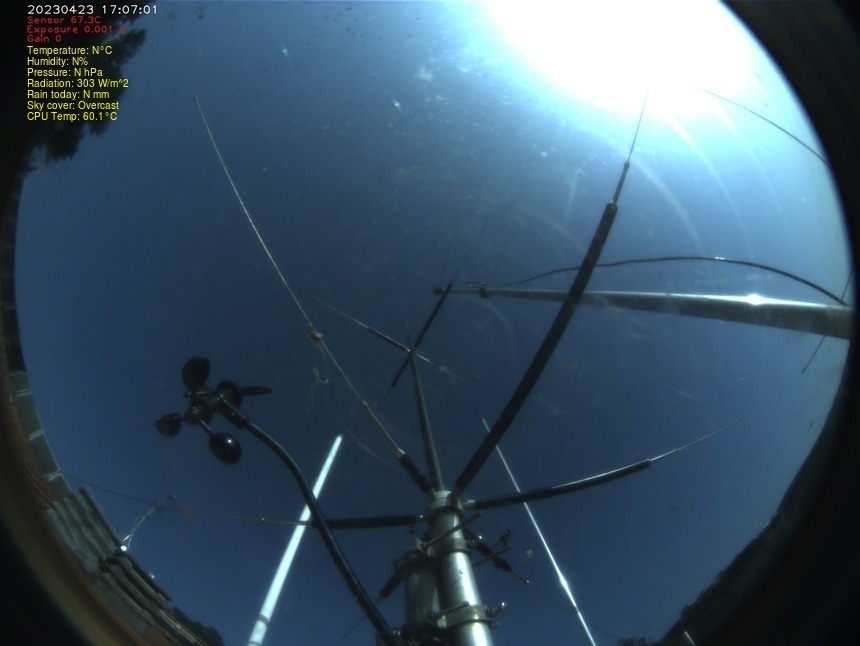
Puoi trovare telecamere simili su: http://www.thomasjacquin.com/allsky-map/
Clouds detector
- Dettagli
- Visite: 19179
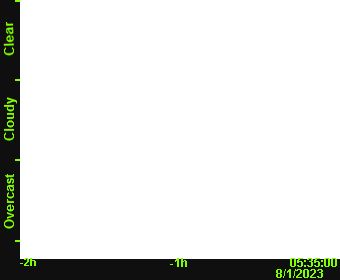
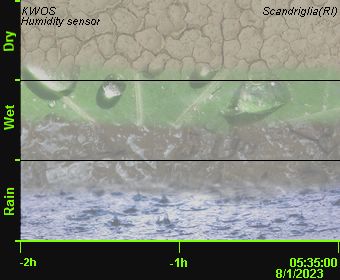
Vista l'importanza di proteggere le attrezzature astronomiche dalla pioggia, la misurazione della copertura nuvolosa è una parte importante di un osservatorio automatizzato indipendente. Consente al sistema di rilevare la presenza di una copertura nuvolosa e, fino a un certo punto, di integrare le informazioni delle condizioni di osservazione quando le nuvole sono assenti.
Questo strumento, insieme alle stazioni e ai rilevatori di fulminazioni, permette di rilevare le condizioni meteorologiche sul sito del KWOS.
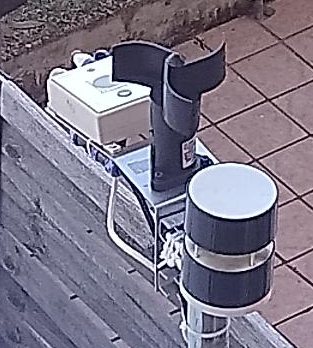
Dopo aver sperimentato l'autocostruzione, ho scelto di acquistare il "Cloud Watcher" della Lunatico Astronomia, corredato, da poco, del Solo
(Un ringraziamento speciale a Debora Sanchez e Jaime Alemany per la loro disponibilità e professionalità)
|
|
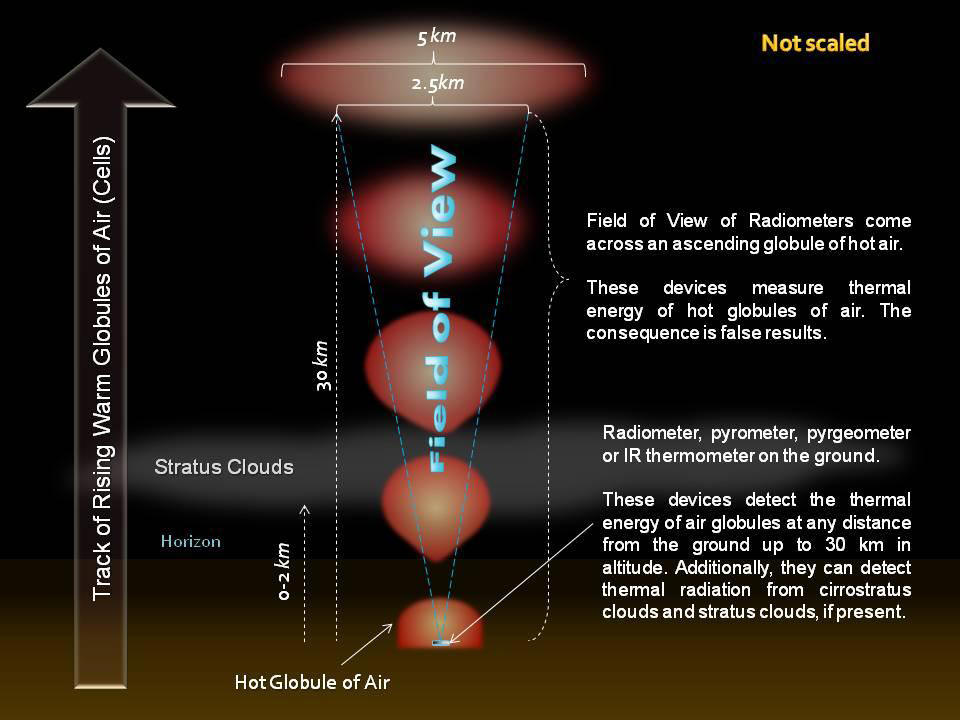
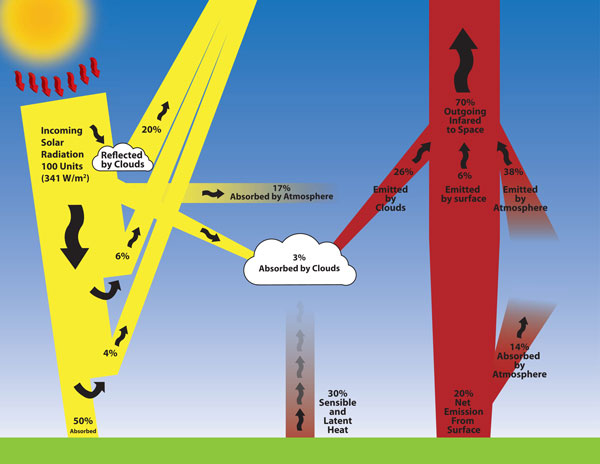
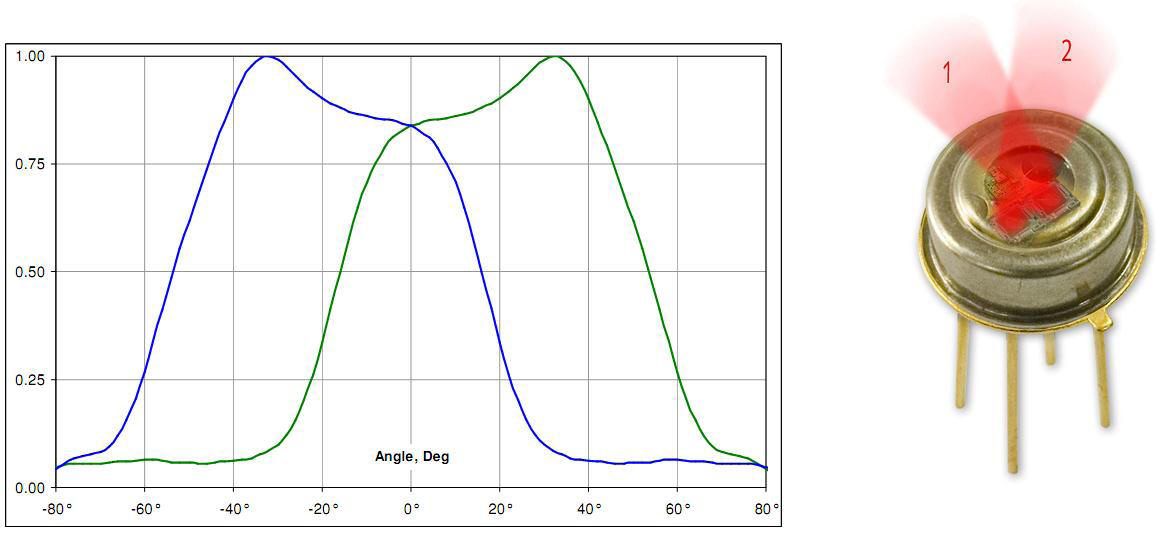
How the sensor works. Sloan, Shaw and Williams (1955) have provided data which show that infra red measurements of the sky at wavelengths above Both clouds and water vapor absorb and re-emit radiation in discrete bands across the infrared spectrum. This permits infrared radiometers, including those configured as IR thermometers, to detect clouds, which are warmer than the clear sky, and water vapor, (Sloan, Shaw and Williams, 1955). Werner (1973) described the use of an infrared thermometer to detect clouds. The thermometer's IR sensor was a thermistor bolometer responsive to 9.5 to 11.5 μm. Today IR thermometry is used to detect the presence and temperature of clouds for meteorological research (Morris and Long, 2006). Both professional and amateur astronomers employ various IR sensors and IR thermometers to detect clouds that might interfere with their observations. For example, the Portable Cloud Sensor (Boltwood Systems Corporation) measures the sky Idso (1982) proposed the theory of measuring water vapor pressure by pointing at the cloud-free zenith sky an infrared thermometer sensitive to a band from 10.5 to 12.5 μm. He successfully tested his theory by conducting field tests. Recently Maghrabi and Clay (2010) described a method for estimating PW in a clear sky based on the ambient temperature and the signal from an IR radiometer designed for cloud detection (Maghrabi et al., 2009) that they described as a single-pixel IR detector. The detector was a thermopile with a spectral response of from 6.6 to >20 μm. They compared their measurements of the cloud-free zenith sky with PW measured by a GPS receiver 30 km north of their location. From October 2002 to July 2004 their IR system provided an estimate of PW with a root mean square (rms) difference of 2.31mm from the GPS PW. Nor is an ambient temperature measurement necessary, for IR thermometers incorporate temperature compensation circuitry that corrects for changes in the ambient temperature. This is usually implemented by employing a 2-element detector, one element being shielded from the source of IR being monitored and the other being exposed to the source of IR. The IR thermometer method is very inexpensive, and the second best results described below were from a $20 instrument about the size of a pocket flash memory drive (Kintrex 401). This Clouds Detector Sensor uses a thermopile sensor (MLX90614 family)directed to zenith. This sensor integrates radiation over the 120° of the sky. Clear view to the sky is important because any terrestrial objects can cause parasite IR radiation. References Forrest M. Mims II, Lin Hartung Chambers, David R. Brooks, 2010 - Measuring Total Column Water Vaporby Pointing an Infrared Thermometer at The Sky |
MSG - GOES
- Dettagli
- Visite: 13250
|
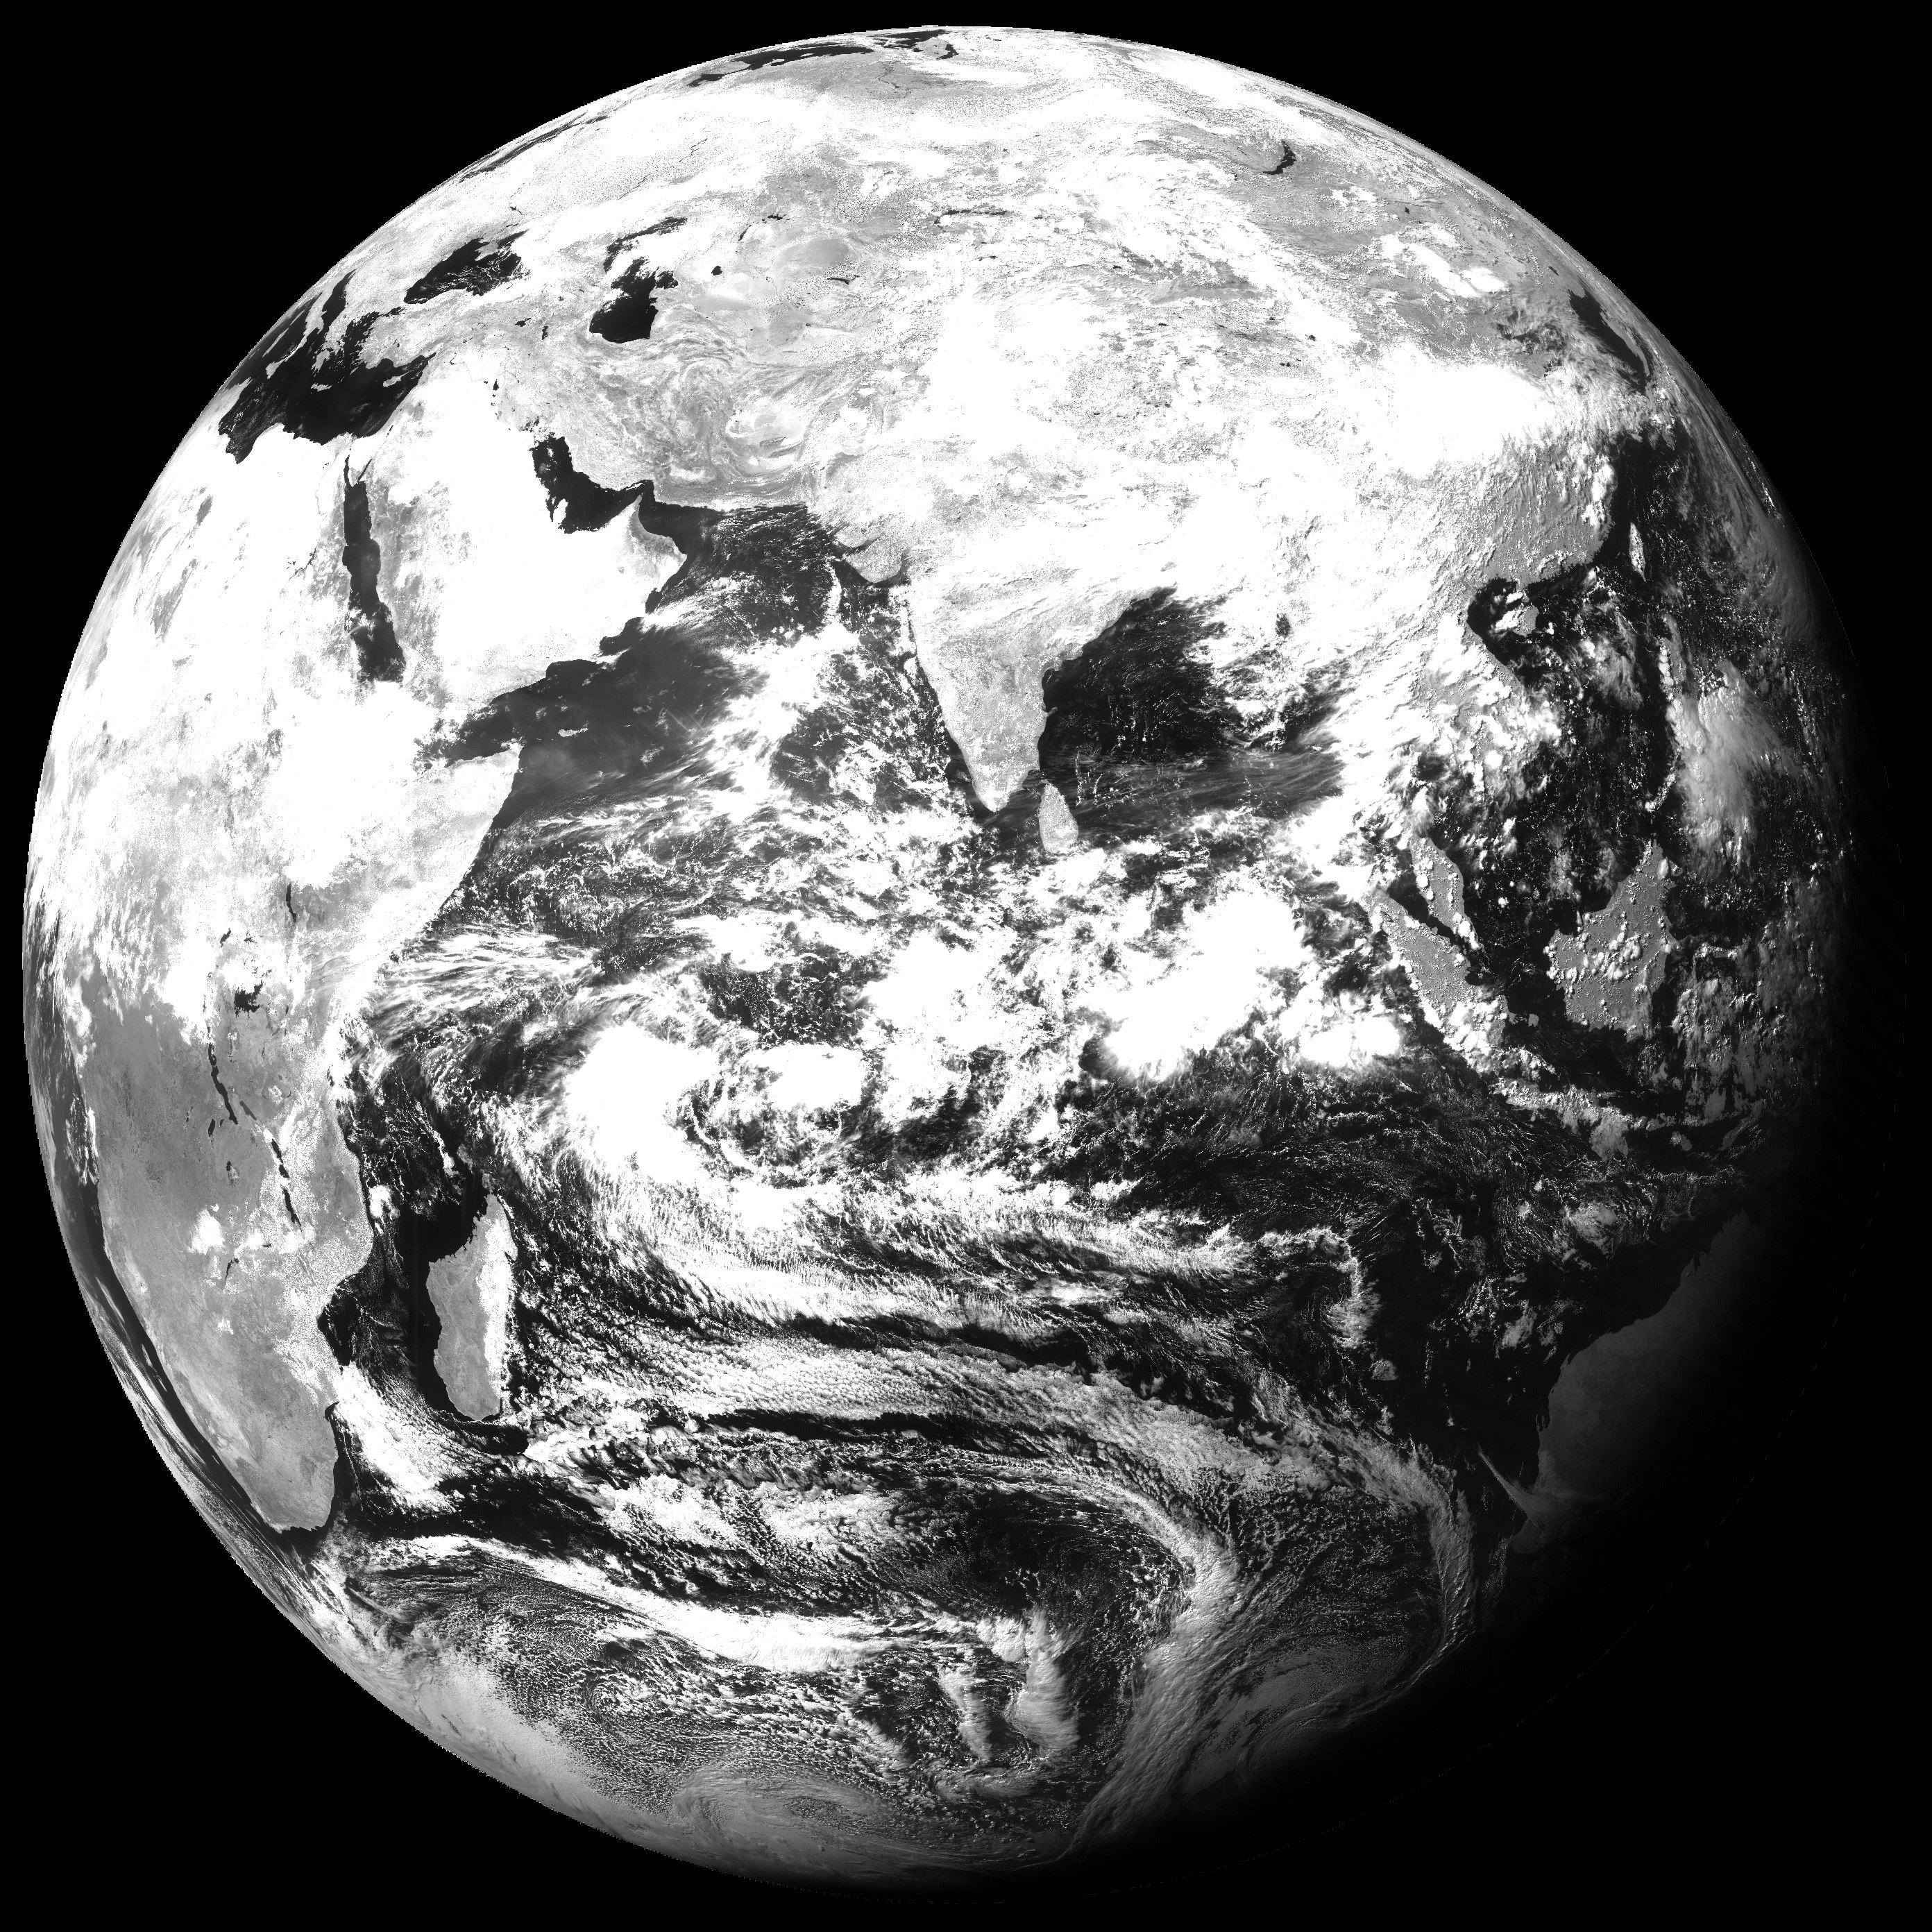
Images of the Geostationary orbiting satellites. |
||
 |
 |
|
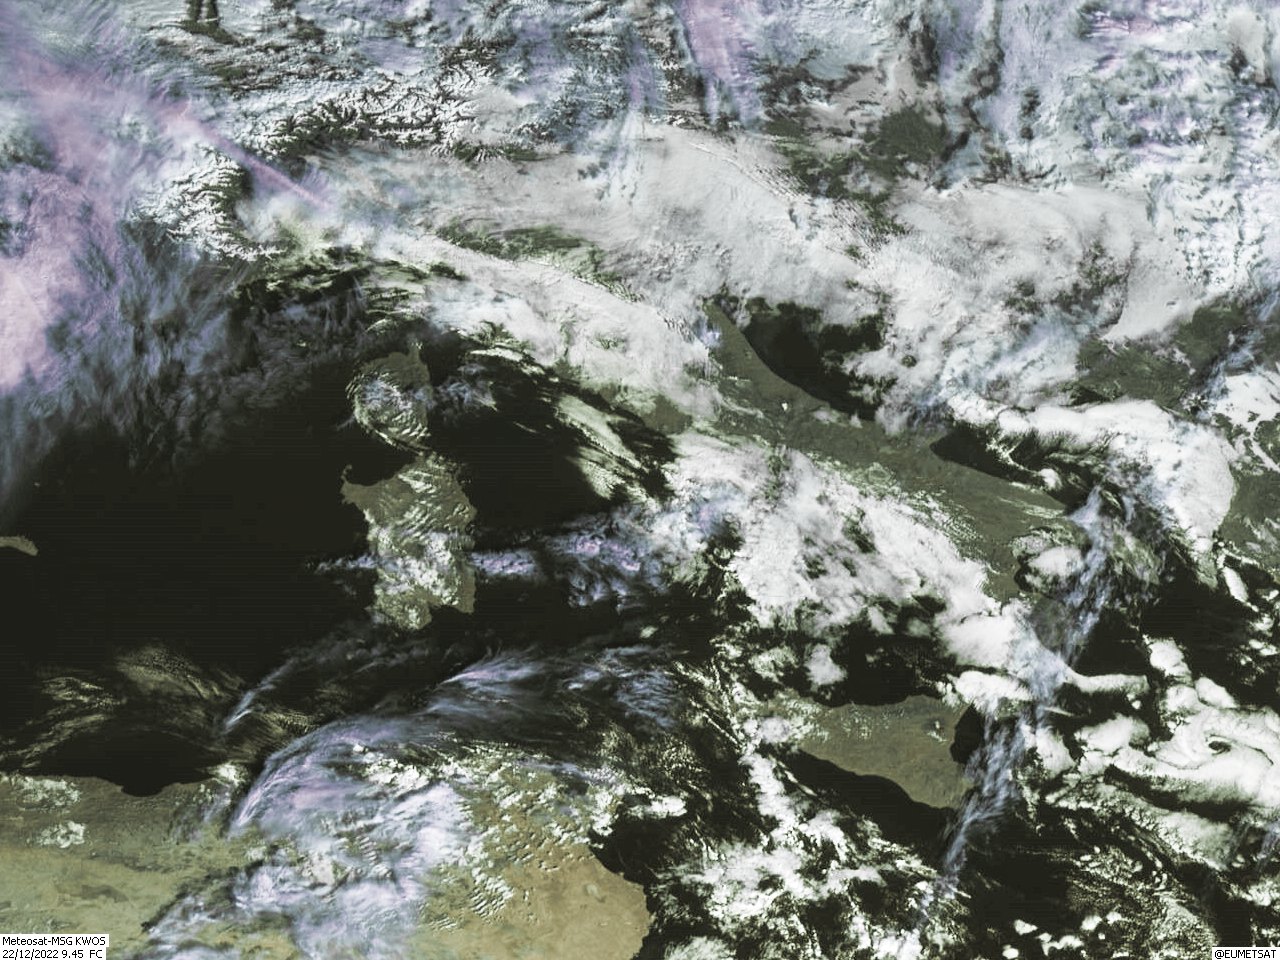
| MSG-3 - Visible channel |
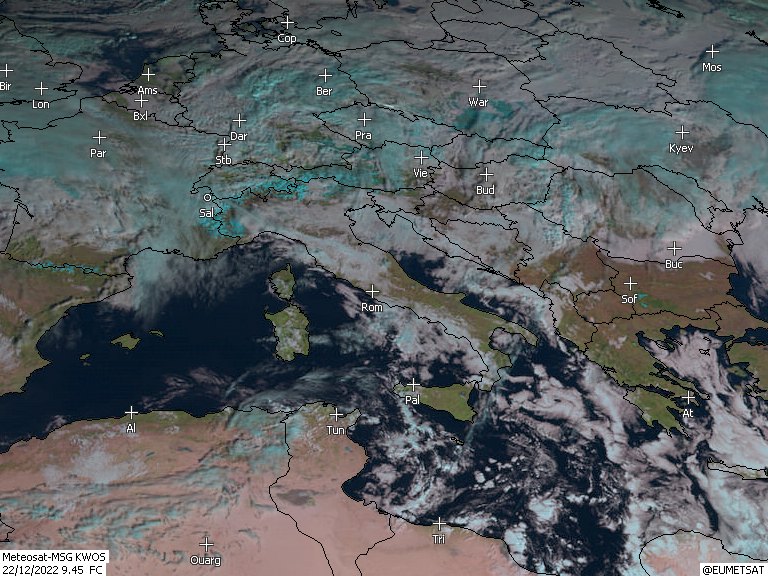
MSG-3 - Visible channel with clouds top highlighted |
|
 |
 |
|
|
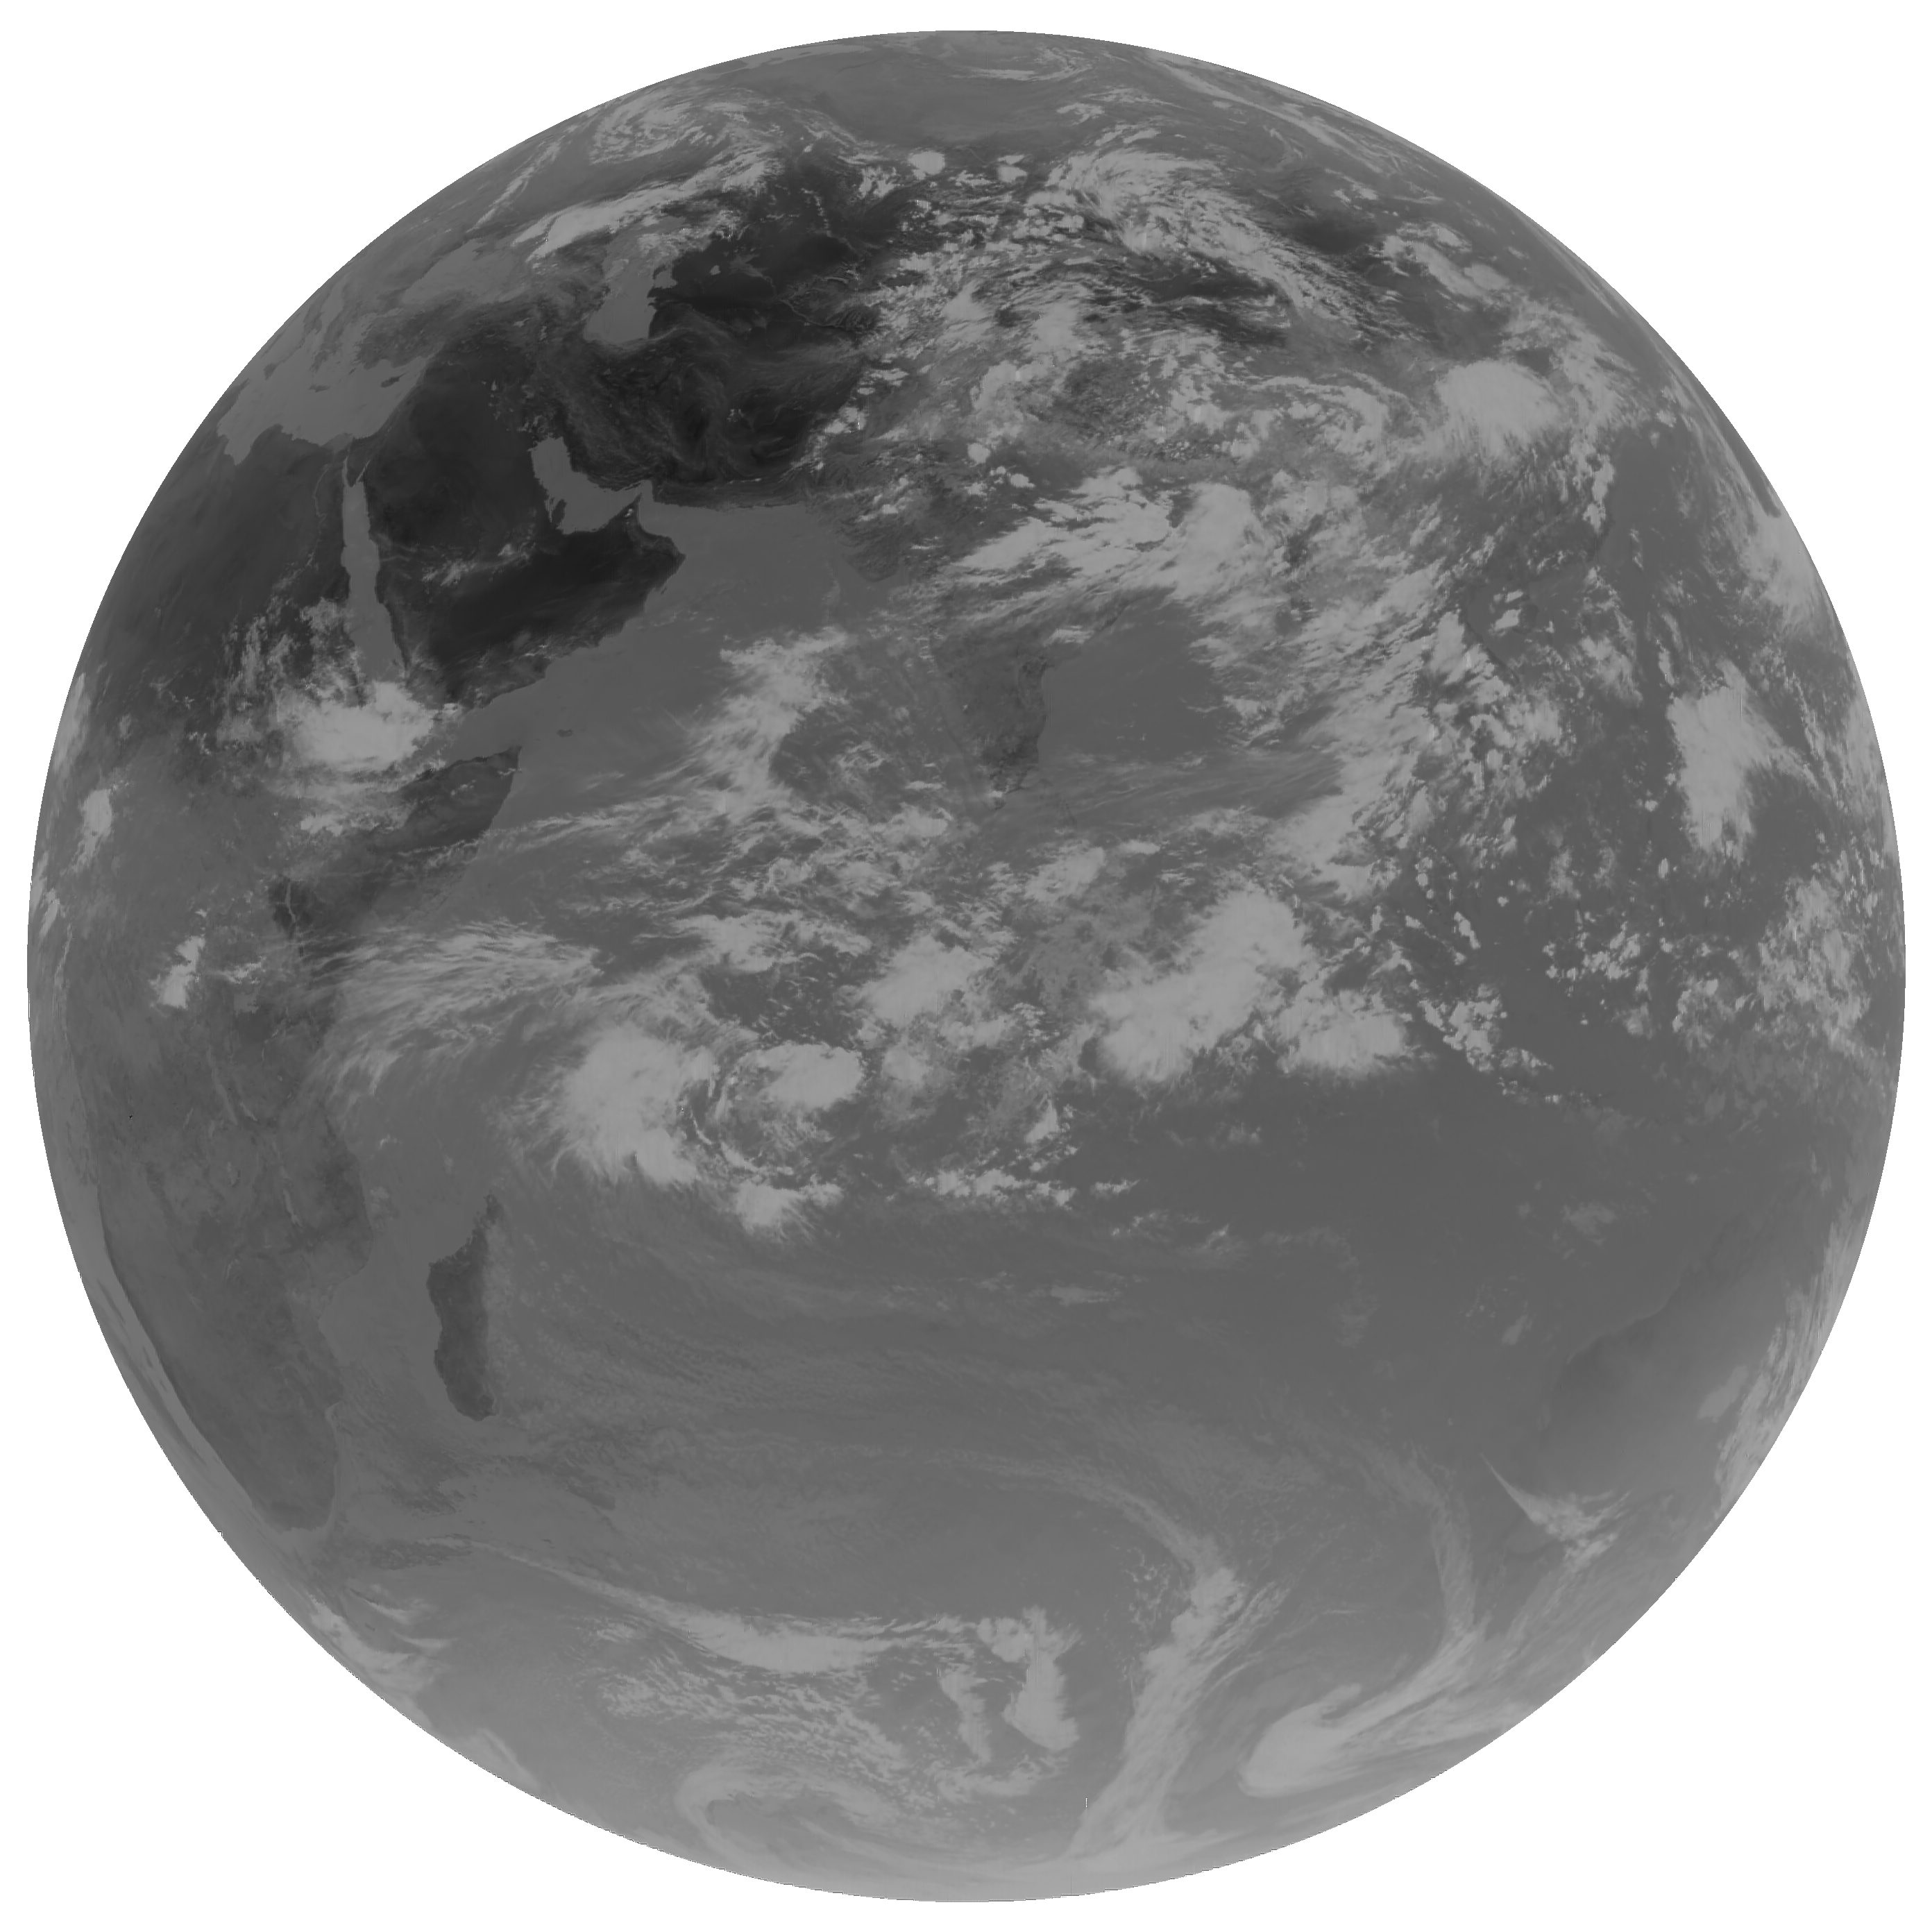
MSG-3 - Infrared and Water Vapour channels |
MSG-3 - Animation of last 6 infrared images |
|
|
|
||
|
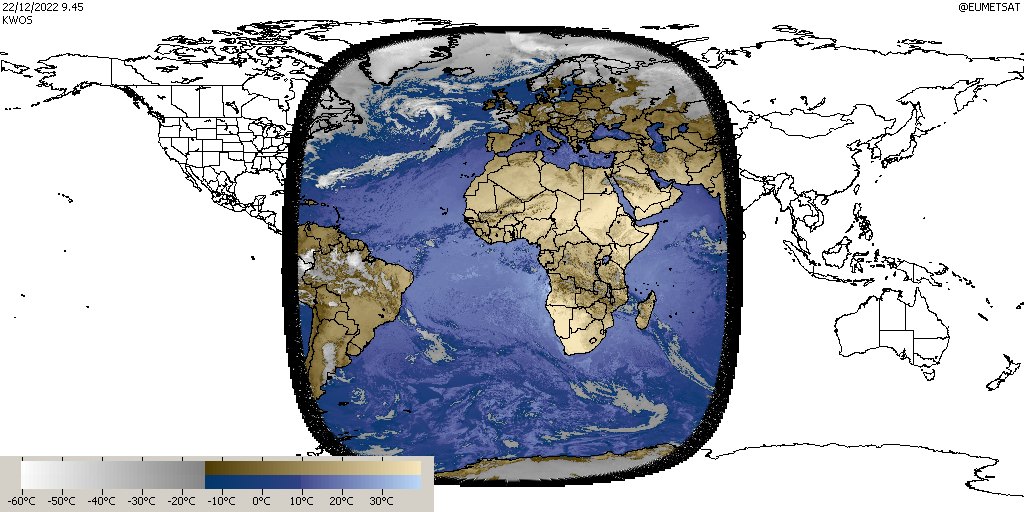
MSG-3 - Current total dish |
||
 |
 |
 |
| FY2H/G Vis1Km - Vis - IR4 - Current total dish |
||
 |
 |
|
| GOMS Vis - IR4 - Current total dish |
||

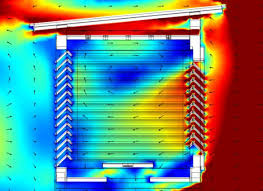 L'overheating (sovra-riscaldamento) e l'overcooling (sovra-raffreddamento) sono due comportamenti che si osservano in alcune condizioni durante i rilevamenti della temperatura dell'aria all'interno degli schermi solari utilizzati per ridurre l'errore dovuto alla radiazione solare.